Heart Rate Variability: The Why, What, and How of HRV and Its Importance in Private Practice – Part 1
Javdat Karimov, MD, NMD
Evaluating heart rate variability (HRV) in clinical practice is important. This is because HRV is a reflection of the autonomic nervous system (ANS) that controls 90% of the body’s functions. The 2 branches of the ANS consist of the sympathetic and the parasympathetic. These 2 branches regulate the slowing and speeding up of the heart rate through their influence on the sinoatrial (SA) node of the heart. This is why we can look at an electrocardiogram (ECG) and be able to look at the beat-to-beat changes between 1 heart contraction and the next, to get an indication of how well the ANS is adapting to internal and external stressors.
What is Heart Rate Variability?
High HRV means that the time domain between each successive heartbeat shows a variable time between one R wave to the next. This indicates good autonomic balance and adaptability. Low HRV means that the time domain between each R wave to the next is constant, hence lacks variability, as far as time goes. These are the people that are stuck in either sympathetic or parasympathetic tone and have lost their ability to adapt. If we turn the R-to-R waves in the ECG vertically, we produce a diagram called a “rhythmogram,” which allows us to get a good visual on the adaptive capabilities of the autonomic nervous system. What’s interesting is that the heart appears to beat very evenly. This is actually not the case. Usually the difference between the shortest and the longest cardiac cycles of a healthy person is 250 milliseconds; this is called the “variational range” (Figure 1). Research shows that those who lack this variation (ie, have low HRV) are more prone to having a myocardial infarction on Monday morning at work.1
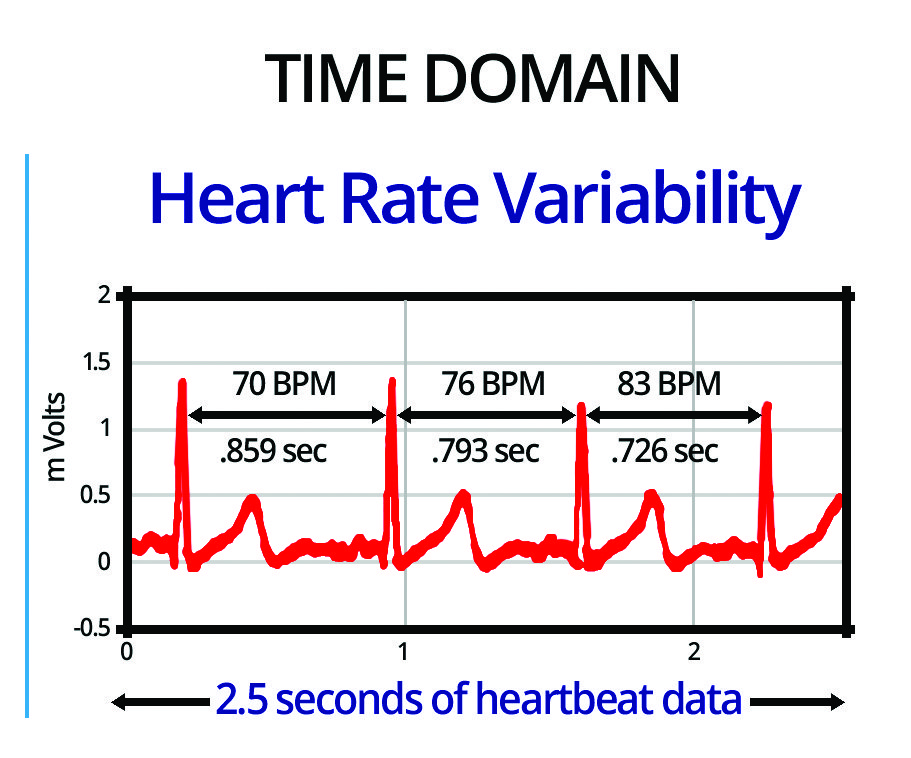
Figure 1. Variational Range of a Cardiac Cycle
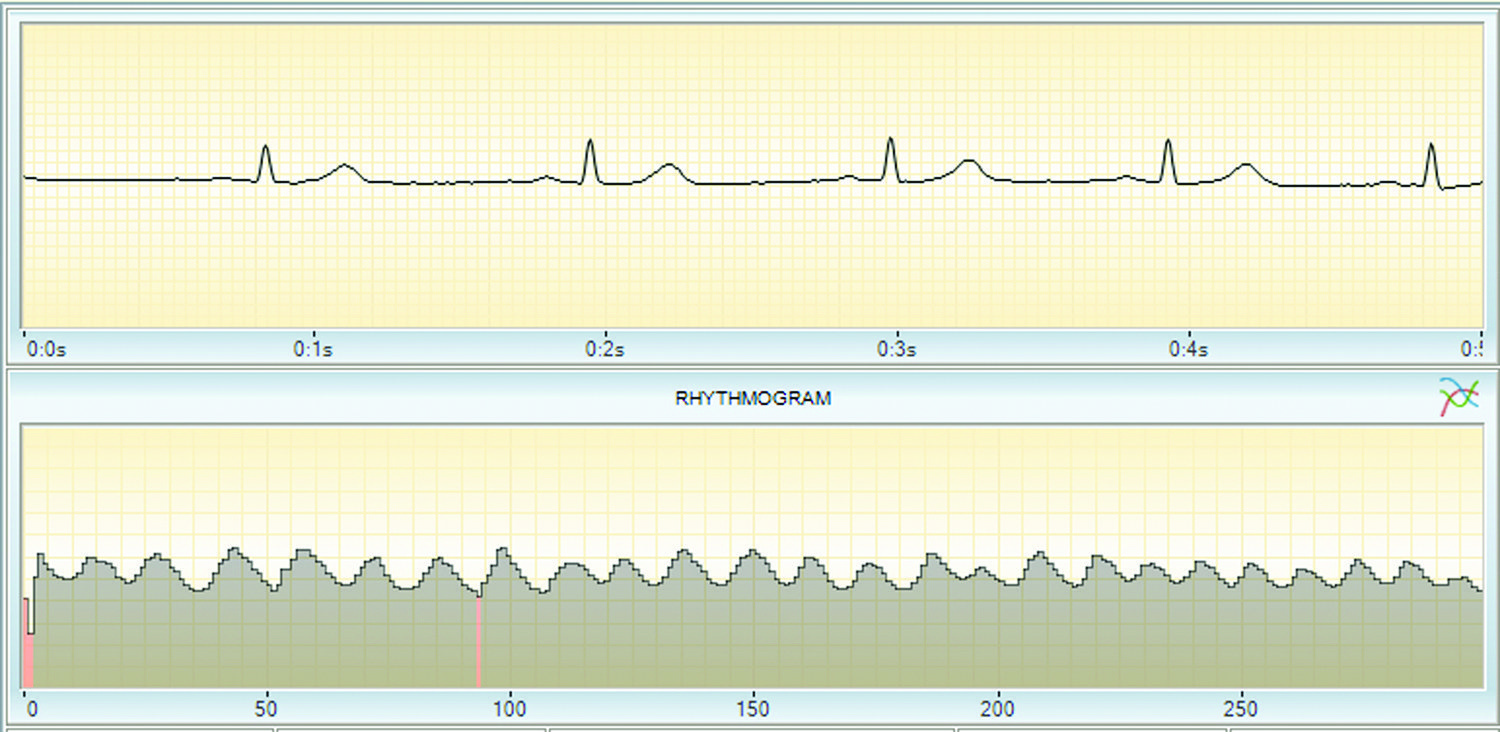
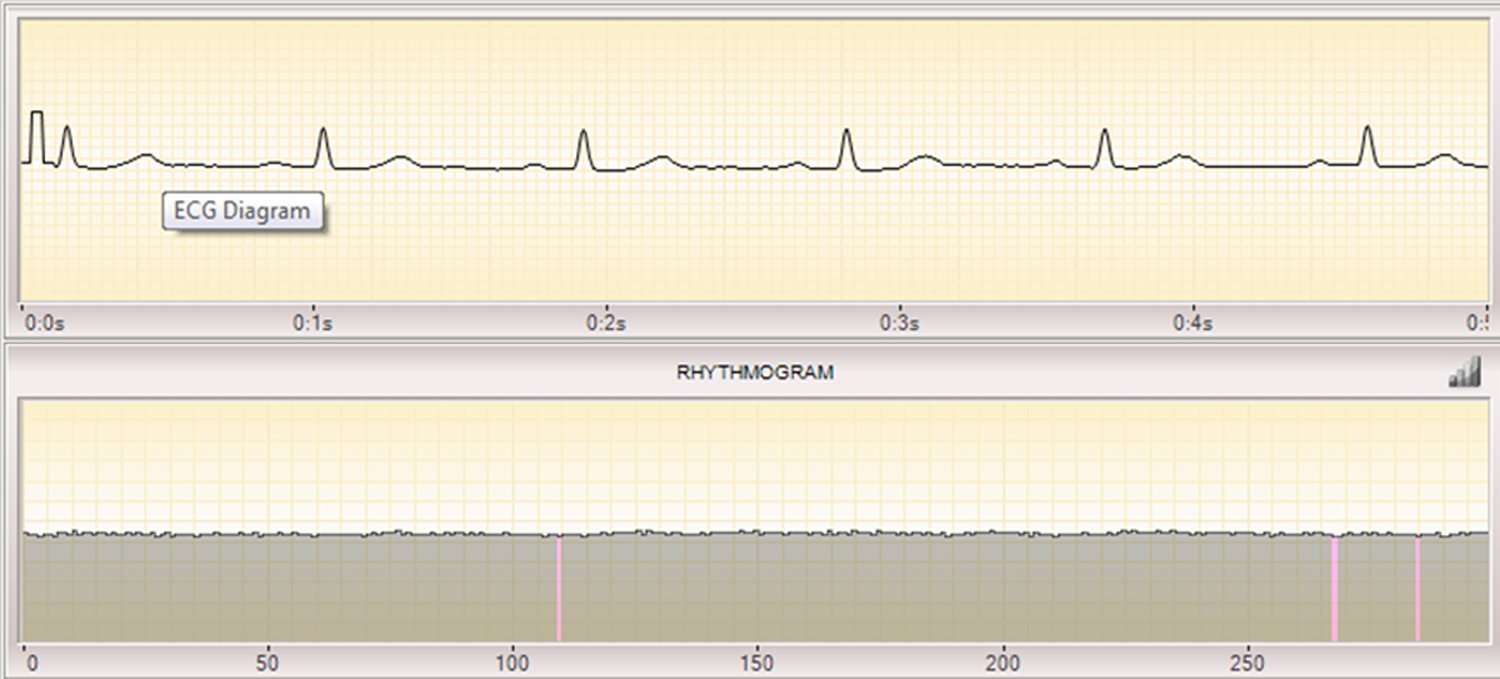
On the rhythmogram shown in Figure 2, you can see that with a quickening of the heart rate, the curve of the rhythmogram goes down, and with a deceleration of the heart rate, it goes up. This is a consequence of the regulatory systems of the body effecting these changes. This way you can see the body responding to the needs of the organs and systems, and the heart changing to meet those needs. The diagram in Figure 2 illustrates healthy HRV, whereas the diagram in Figure 3 shows very low HRV.
How HRV Can Reflect Neurohormonal Regulation
The other key components of heart rate variability are Low Frequency, High Frequency, Very Low Frequency, Stress Index, Vital Force, and SDNN (Standard Deviation of Normal-to-Normal beats). Once we explain these concepts, you will be a connoisseur of HRV. There are 3 regulatory systems that can be decoded from a technique called Fast Fourier Transform, which reflects how often waves of a definite length appear on the ECG. The graph obtained from this procedure is called a spectrogram. Basically, we break down the ECG into its frequency-component bandwidths that correspond to specific regulatory system. A good analogy for Fast Fourier Transform is a prism that separates the complete light spectrum into its individual color frequency bands. Low frequency (LF) corresponds to sympathetic nervous system regulation, and high frequency (HF) corresponds to parasympathetic regulation. Very low frequency (VLF) reflects the central nervous system (CNS) and its regulation through its downstream hormones.2 An easy way to show this is through a simple pie chart (Figure 4).
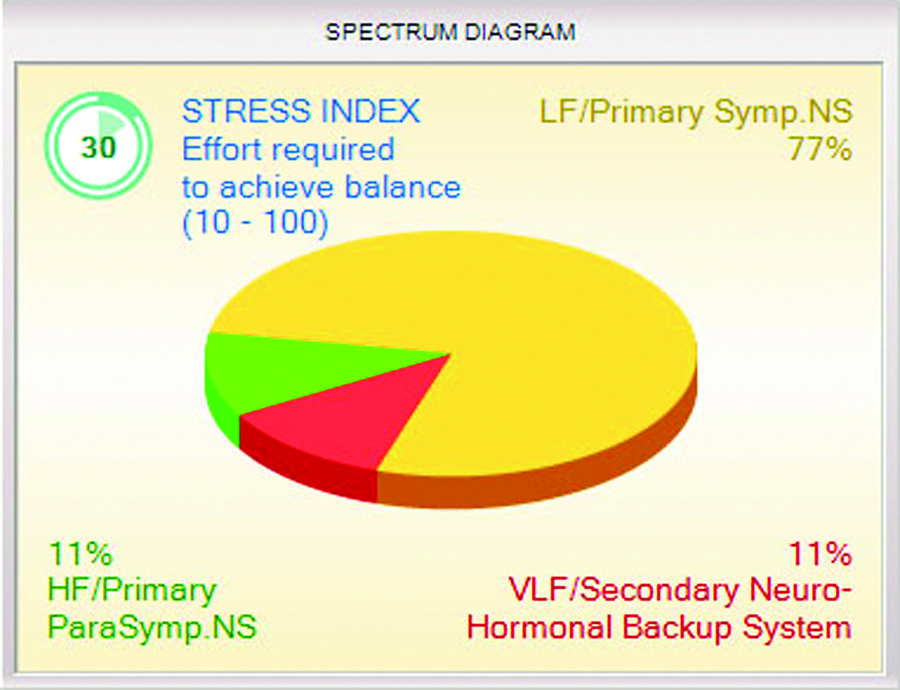
Figure 4. Balance of Regulatory Functions: Sympathotonia
In the Figure 5 diagram, the top pie represents a normal balance of LF, HF, and VLF, while the other pies represent various imbalances of the sympathetic, parasympathetic, and neurohormonal regulation. Before we discuss the clinical implications of LF, HF, and VLF, we need to discuss the Stress Index. This is a common mathematical value found in some HRV systems, and tells us how hard the ANS has to work to maintain balance. If it is above the normal range, it is like driving your car without a thermostat; eventually the engine is going to heat up and seize. Another standard HRV value is the SDNN. This is the most common index of overall HRV, as it reflects the ability to respond quickly, dynamically, and effectively to a stressor. The last index is Vital Force, which tells us how much “fuel” the patient has in his or her engine. If it is low, the use of gentle therapies or detoxification is indicated, so that the patient isn’t pushed beyond his or her capacity to tolerate the treatment.
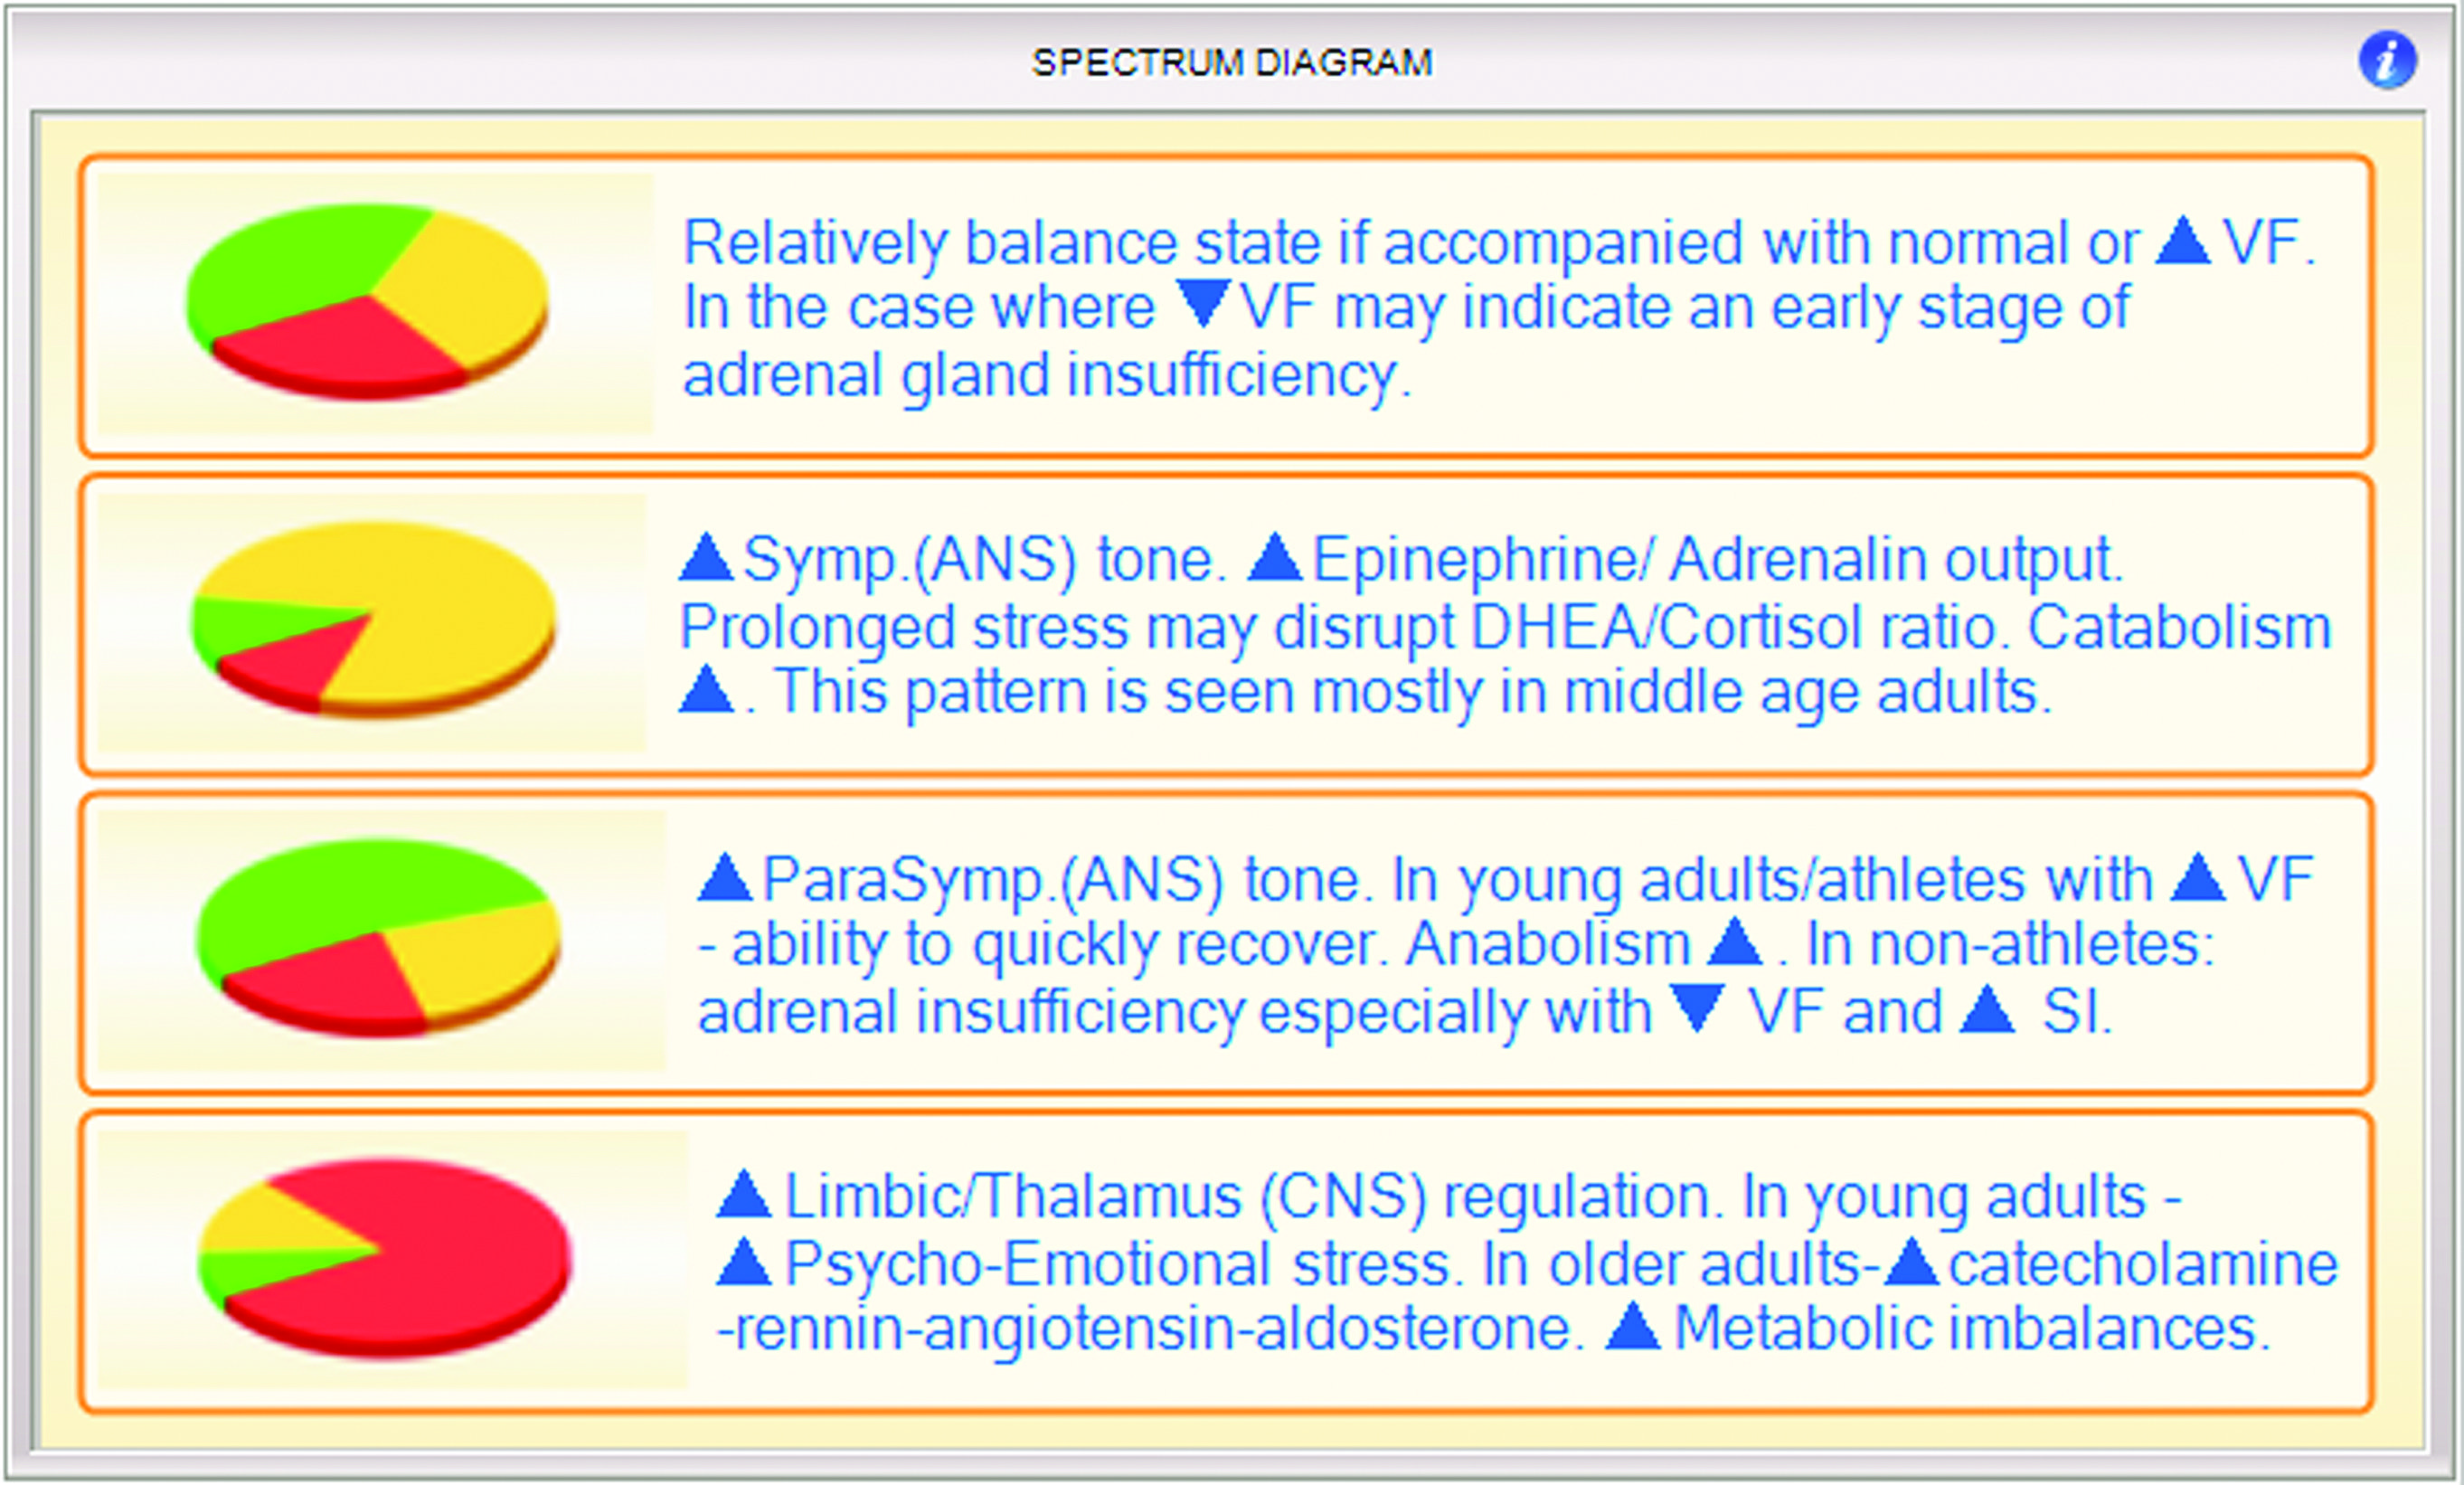
Figure 5. Balance of Regulatory Function: Variations
Closing Comments
In Part 2 of this discussion, we will review all the other important information derived from heart rate variability, such as cardiovascular adaption, ANS regulation, neurohormonal regulation, and psychoemotional state,3 and see how it all ties together. Research coming out of Russia includes some very provocative studies on the use of HRV to assess thyroid balance or imbalance,4 to indirectly evaluate brain function, to obtain very accurate information about the Chinese meridians, and more. Once you understand the basics, I will show you patient cases in which all of the information is tied together in a seamless fashion. In private practice, an advanced HRV model will allow you to know if the therapies you are using are improving your patients’ health ,or if their health is staying the same or getting worse.
 Javdat Karimov, MD, NMD, is a naturopathic physician with an MD background (Russia) in anesthesiology and emergency medicine. He graduated from National College of Naturopathic Medicine in 2003, and since then has maintained a private practice in Portland, Oregon. Dr Karimov has over 20 years of clinical experience focusing on cardiology, Eastern medicine (Traditional Chinese Medicine), Ayurveda, Tibetan and Quantum healing. Dr Karimov is actively involved in researching the health benefits of quantum medicine. In addition to his clinical work, Dr Karimov is CEO of Global Health Solutions, where he designs and sells assessment tools for the healthcare practitioner.
References
- Sandercock GR, Brodie DA. The role of heart rate variability in prognosis for different modes of death in chronic heart failure. Pacing Clin Electrophysiol. 2006;29(8):892-904.
- Bayevsky RM, Ivanov GG, Chireykin LV, et al. HRV analysis under the usage of different electrocardiography systems (Methodical recommendations). Committee of New Medical Techniques of Ministry of Health of Russia. 2002;4:2-67. DrKucera Web site. http://www.drkucera.eu/upload_doc/hrv_analysis_(methodical_recommendations).pdf. Accessed April 15, 2014.
- Tonhajzerova I, Ondrejka I, Turianikova Z, et al, Heart Rate Variability: An Index of the Brain-Heart Interaction. In: Yamada T, ed. Tachycardia. Rijeka, Croatia: InTech Europe; 2012:185-202.
- Moldabek G. Heart Rate Variability Indicators in Patients with Hypothyroidism. Medical and Health Science Journal. 2011;6:127-131. http://academicpublishingplatforms.com/downloads/pdfs/mhsj/volume6/201104140229_26_V6_MHSJ_KZ_Moldabek_Gulnar_Heart_Variability.pdf. Accessed April 15, 2014.