

Electroencephalogram Use in Autistic Disorder Assessment
Steven Rondeau, NMD, BCIA-EEG
The electroencephalogram (EEG) is a leading tool in the evaluation of autistic spectrum disorders (ASD).1 The EEG is most commonly thought of in the conventional medical community to be utilized with seizure disorders, which coincidently, are present in about one third of children with autism.2 Other methods of neuroimaging have been used in the past, but usually require sedation or even radioactive dye injections. Due to its ease of availability and noninvasive nature, EEG may be the most helpful in identifying the areas of unique variability in the brains of children with ASD.
The cortex of the human brain produces small amounts of electrical activity that can be amplified and measured.3 The EEG is a collection of this electrical activity of the brain that can then be recorded and measured. What was initially very interesting for me regarding the use of EEG in autism is that Robert Coben, PhD and his colleagues have been able to distinguish autistic children from neurotypical children by looking at the quantitative electroencephalogram (qEEG) alone, with a success rate of 88%.4 In the discussion below, I will outline the most common findings and how we work to correct these findings.
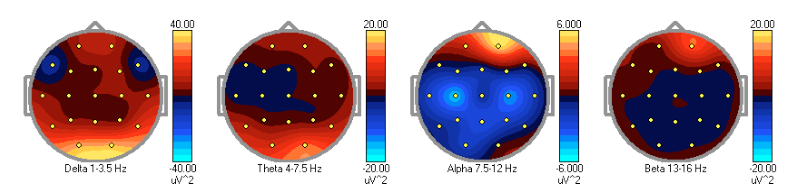
Many of the symptoms of autism are now largely thought to be a final end result of brain dysfunction with multiple organ system involvement.5 Through qEEG, or brain mapping, we are able to measure (quantify) the electrical activity summation in a given region of the brain to localize the area of dysfunction. We know from previous studies and collections of data that various brainwaves should be distributed throughout the brain in normal, consistent patterns with some small degree of variability.6 With qEEG findings, we are now readily able to localize the areas of electrical dysfunction. The process begins when the EEG data is collected painlessly via 19 electrodes placed on the scalp. The EEG is then acquired via an amplifier and stored on a computer. The qEEG process is first to remove artifact (movement, interference, noise, etc) and convert the waveforms into a quantitative measurement, which is very often displayed as a topographical “map”. This quantitative output can then be interpreted and a treatment plan applied to correct the abnormal findings using EEG biofeedback, now primarily known as neurofeedback. In addition, new groups are marketing products that allow the practitioner to select medications, supplements or herbs that can affect the precise area of the brain with abnormal functioning.7
Recurring Patterns of qEEG in ASD
In my clinical experience, patterns in the qEEG are consistently helpful for locating affected areas that are often likely an underlying reason for the presenting symptoms. Of the many autistic children I treat, each is very different behaviorally and biochemically. However, I have observed that there are few recurring qEEG patterns in children with ASD.
The first pattern I see often in ASD is excess slow wave activity (delta, theta). There may also be excess fast (alpha, beta) brainwaves present relating to hyper- or hypofunctioning of the localized area. For example, if a patient struggles in a particular area such as reading, identifying letters, math or language, it is possible that the area of the brain that is highly involved in those particular functions is affected with hypofunction (excess slowing or deficient fast waves) or even seizure activity. In contrast, anxiety and sleep disturbances are often identified in qEEG by hyperfunctioning (excess fast waves or deficient slowing).
The second recurring pattern in the qEEGs of autistic children that has been discussed in the literature by Coben, and that I have seen clinically, is the presence of a particular rhythm called “mu”, which is a characteristic waveform found in the 8-13Hz (alpha) range over the sensorimotor cortex. Thought to reflect the mirror neuron activity, this variant is a likely explanation for many of the children’s behavioral imitation impairments, or to disturbances in the ability to observe and mimic an instructed task.8 In a 2007 study, the authors found the degree of impairment of imitation ability was directly related to the degree of attenuation of the mu rhythm.9
The third recurrent pattern is a general disruption in the overall connectivity (shared variance) of the different lobes to themselves and to each other, known as hyper- and hypoconnectivity. Connectivity is pragmatically defined as how the brain connects and “talks” to itself. Generally speaking, hyperconnectivity often presents with complaints of sensory integration, emotional and language impairments. Hypoconnectivity often presents with regional brain and social impairments.10 From my experience, I have found that it is common to measure increased slow activity in a small posterior region in the right hemisphere (the fusiform gyrus) of autistic children. This particular area is known to be highly involved in the processing of facial recognition and emotions, which may explain the impaired social interactions these children often experience. This is a very interesting finding and appears to be consistent.
Methodological and Technical Considerations
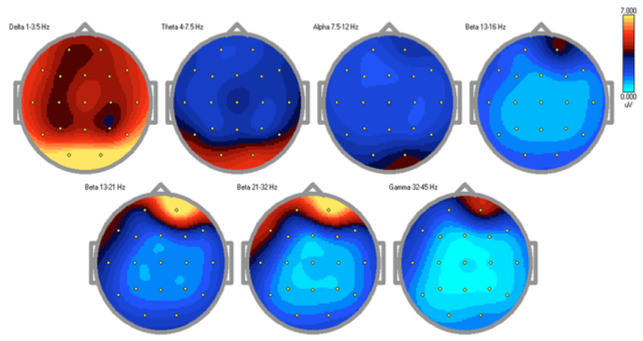
The electroencephalograph is recorded using 19 electrodes with the international 10/20 system of electrode placement. After the impedances are reduced to below 5 Kohms, the EEG is then recorded continuously while the patient is awake for 10 minutes with eyes closed, followed by 10 minutes of eyes open. This of course can be a challenge with this difficult population and I would suggest practice on healthy subjects who are better able to cooperate during the initial training process. Steps following the recording are to visually inspect the data and reject artifacts present. The subsequent steps are to compute the fast fourier transform (FFT) providing spectral analysis output which is examined for aberrant activity or patterns, and is finally compared to an age-appropriate population of referenced normative data. Several software programs and databases are available. The output is then displayed in a number of ways including topographical maps such as those shown.
What these findings also depict is the heterogeneity of brain abnormalities found in ASD, further supporting the wide variety of effective treatments, and suggests that a one-size-fits-all approach may not be appropriate in the treatment of autistic spectrum. This may additionally explain the limited number of medications approved for treatment of ASD. Using EEG-guided neurofeedback, there is a success rate of nearly 89% in the reduction of ASD symptoms, suggesting this is a very promising therapy for these children.11 In contrast, a parent-reported symptoms checklist conducted by the Autism Research Institute12 reported that the only FDA-approved medication to treat behavior-related problems associated with autism, risperidone, has an improvement to worsening of symptom ratio of 2.8:1. What this means is that for every 3 kids given risperidone, 1 will have a negative reaction. In comparison, correctly administered qEEG-guided neurofeedback has virtually no negative side effects.
You may be asking yourself how all of this applies to naturopathic and biomedical treatments of autism. The way I like to think about it is that the symptoms of autism are essentially an end product of all of the affected metabolic, gastrointestinal, detoxification, allergic, etc. processes creating neuro-inflammation and neurotoxicity that produce structural and electrical changes in the brain. With proper treatment, as we make changes in the rest of the functions in the body, the changes to brain and neural connections that produce the symptoms we call autism, can potentially be corrected using EEG-guided neurofeedback.
In summary, with or without seizure activity, EEG data can be very useful in the evaluation and formulation of treatment plans for ASD. I will continue doing research in this area including presentations during this year’s International Society for Neurofeedback and Research conference, which focuses primarily on the study and treatment of EEG and brain abnormalities.
 Steve Rondeau, NMD, BCIA-EEG graduated from SCNM and is currently practicing in Sandy, Utah at Healing Solutions Pediatric Centers. In addition to being BCIA certifeid in EEG biofeedback, Dr. Rondeau is a Defeat Autism Now (DAN!) registered physician. Much of his training in pediatrics has been focused on the treatment of children with developmental disorders such as ADHD, learning and language disorders, PANDAS, autism spectrum disorders, anxiety, depression, traumatic brain injuries, and seizures. In his practice, he utilizes therapies such as nutrition, IV therapies, hyperbaric oxygen therapy, and neurofeedback.
References
- Ekinci O, Arman AR, Isik U, Bez Y, Berkem M. EEG abnormalities and epilepsy in autistic spectrum disorders: clinical and familial correlates. Epilepsy Behav. 2010;17(2):178-182.
- Tuchman RF, Rapin I. Regression in pervasive developmental disorders: seizures and epileptiform electroencephalogram correlates. Pediatrics. 1997;99(4):560-566.
- Teplan M. Fundamentals of EEG measurement. Measurement Science Review. 2002;2(2):1-10.
- Coben R, Clarke AR, Hudspeth WJ, Barry RJ. EEG power and coherence in autistic spectrum disorder. Clin Neurophysiol. 2008;119(5):1002-1009.
- Ming X, Julu PO, Brimacombe M, Connor S, Daniels M. Reduced cardiac parasympathetic activity in children with autism. Brain Dev. 2005;27(7):509-516.
- Demos J. Getting Started with Neurofeedback. New York, NY: WW Norton; 2004:60-96.
- Melville N. Quantitative EEG can guide treatment of depression. Medscape website. http://www.medscape.com/viewarticle/711854. Published 2009. Accessed March 30, 2010.
- Oberman LM, Hubbard EM, McCleery JP, Altschuler EL, Ramachandran VS, Pineda JA. EEG evidence for mirror neuron dysfunction in autism spectrum disorders. Brain Res Cogn Brain Res. 2005;24(2):190-198.
- Bernier R, Dawson G, Webb S, Murias M. EEG mu rhythm and imitation impairments in individuals with autism spectrum disorders. Brain Cogn. 2007;64(3):228-237.
- Toal F, Murphy DG, Murphy KC. Autism-spectrum disorders: lessons from neuroimaging. Br J Psychiatry. 2005;187:395-397.
- Coben R, Padolsky I. Assessment-guided neurofeedback for autistic spectrum disorders. Journal of Neurotherapy. 2007;11(1):5-23.
- Parent Ratings of Behavorial Effects of Biomedical Interventions. Autism Research Institute (ARI) Web site: http://www.autism.com/treatable/form34qr.htm. Published February, 2008. Accessed March 30, 2010.


